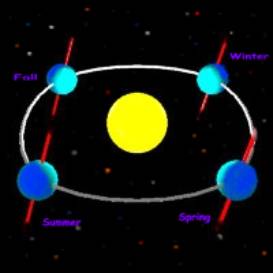
The Tilt of the Earth during the Various Seasons
Observation shows at the Fall Equinox, the Earth is tilted to the right in a perpendicular relationship at the intersection of its orbital path with the Sun.
Due South
|
This Paper, Due
South was first released as a test thread on a certain forum stating
that the arc track of the moon was very low or abnormal across the night
sky. Immediately, there was stiff opposition in the main from amateur
and professional debunkers who countered the information. The first
reaction was all is normal the moon is tracking normally, high in the night
sky with the usual reference to the GoTo scopes.
This continued until they found the US Naval Astronomical Applications Dept website for moon
altitude. [Table 1 at the end the
paper] Then
this certain group flipped positions and used the government website data as
evidence that the Moon should have a maximum height of 18 degrees above
horizon at 180 degrees east of north or due south thus
agreeing with I first reported as normal, but is it?
The track of the Moon across as first reported in the Grant Chronicles in the Low Arc of the Moon has become apparent. As one looked into the southern sky during the Fall Equinox on September 22, the point of the Moon’s zenith should have been near 67.6 degrees at latitude 43o18’ North plus or minus 5 8’ degrees after taking into account the sinusoidal decrease of 2.9 degrees (Math) from the reference 23.5 degree for the 11degree orbital movement towards the full position. The tilt of the Earth is at its maximum toward the moon in the first quarter position, which occurred on September 21 8:54 a.m. What is odd is that most tables related to the altitude of the moon for this date did have 18.7 degrees but observation coming in from different parts of the country with a similar latitude recorded approximately 30 degrees. |
|
|
The Tilt of the Earth during the Various Seasons Observation shows at the Fall Equinox, the Earth is tilted to the right in a perpendicular relationship at the intersection of its orbital path with the Sun. |
Diagram 1
Diagram 2
|
In this diagram 2 you can visualize the tilt of the Earth at the fall Equinox towards the Moon its 1st quarter position and how it is perceived by a person observing from the Northern Hemisphere. In the following Diagram 3 we see the relation between the Sun, Earth and the Moon in a top view. |
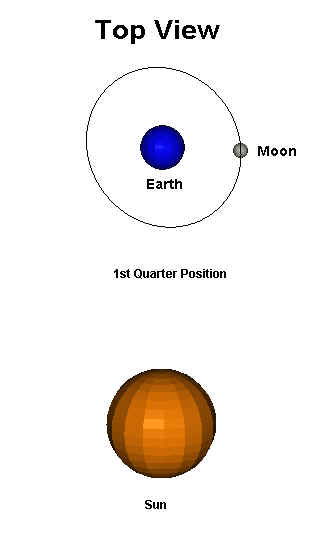 |
Question? If the Earth is tilted 23.5 degrees towards the 1st quarter Moon then how does the official statistics show the highest arc for the Moon at 18.9 degrees for Syracuse?
|
Diagram 3
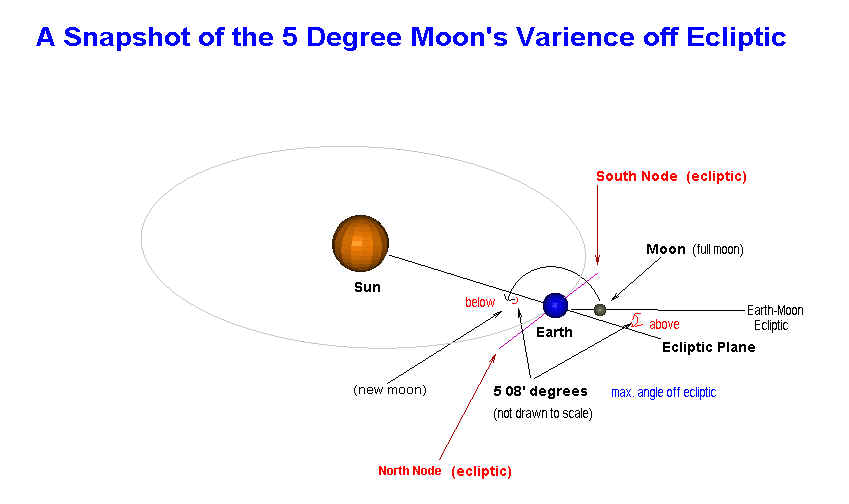
Diagram 4
|
In Diagram 4: it shows the relationship between the ecliptic, the orbital plane of the Moon and its nodes. |
 |
Observation
The view for an observer located at 43 degrees latitude during the first quarter phase of the Moon would be at 70.5 degrees {(90-43=47)+ 23.5} + or - 5 8' degrees. As the tilt of the earth is 23.5 degrees perpendicular to the right of the Sun during Fall Equinox. |
Diagram 5
The Conclusion
|
The Moon's altitude observed in Syracuse, NY was approximately 30 degrees far below what the textbooks say and still 11 degrees above the official reports. What type of a force would be needed to move the orbital path of the Moon yet the Earth seems unaffected? Why are the official numbers and textbook results radically different, but neither source correct? |
Newton's First Law of Motion:
| I. Every object in a state of uniform motion tends to remain in that state of motion unless an external force is applied to it. |
Astronomical
Applications Dept.
Syracuse N43o 02'
http://aa.usno.navy.mil/data/docs/AltAz.html
Table 1
|
|
All Rights Reserved:© Copyright 2004