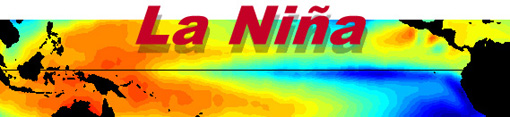
The La Nina Effect
Increased Hurricane Activity
Scientists are linking the an increase in hurricane activity to the La Nina effect in the Pacific, but are the trends over the last century backing this statement? An increase in hurricane activity has occurred over the last twenty years as ocean temperatures has risen due to an overall change in global climate, but its true cause is that the Earth is warming. The La Nina event predicts warmer temperatures in the southeast, but colder winter temperatures in the north central states. This year all of North America is experiencing a warming trend while Europe is in a deep freeze so could La Nina effects be responsible for these global events? Careful analysis of hurricane trends over the last 100 years of weather data concerning the occurrences of La Nina do not back an increase in hurricanes related to this event, but does show a dramatic increase in the last 20 years. Data between the years of 1903 and 1986 show no average increase in hurricane activity in a La Nina year in fact a slight decrease from the previous year, reference table below yellow zone. After 1986 there is a significant increase in hurricane activity in correlation to the La Nina effect, reference table below red zone, but in reality the increase is a general trend related to ocean warming as hurricanes have average above the long term average of 10 storms per year since the nineties. Current weather models will stray farther from the norm as all forecast models become useless. La Nina predicted colder north central states, this has not happened. La Nina experts have forecasted higher hurricane levels, but data reveals no connection over the last 100 years that is concrete, the general upward trend is related to warmer oceans. La Nina experts have call for an increase in hurricane activity from 2005 record 27 storms, but Dr. Grey predicts 17, is this an attempt to play both sides so someone's forecast wins? What the experts are faced with at Colorado State and the NOAA is how to explain increased hurricane activity to an apathetic American population without alarm. This cover story is a good attempt as short term trends back it, because few will dig deeper accepting a comfortable answer from trustworthy sources and those that do will be ignored as opposed to admitting that something is gravely wrong. How can you blame the government for covering up the truth when few want to here or care about the truth as it disturbs a life style that does not consider what happens to the rest of the world as long as home is safe? Anyway a new phase will be coined during the upcoming hurricane seasons courtesy of the weather desk at CNN "The Conga Line" as hurricane after hurricane line in formation behind one another assaulting the U.S. coastlines.
Reprint of CNN Story
ATLANTA, Georgia (AP) -- Climate experts have confirmed the start of La Nina -- a mild cooling of the tropical Pacific Ocean that often coincides with stronger and more numerous hurricanes, a wetter Pacific Northwest and a drier South.
La Nina will probably last through late spring and possibly through the summer, Edward Alan O'Lenic, chief of the National Oceanic and Atmospheric Administration's Climate Prediction Center, said Thursday.
The center confirmed jet stream changes and lower-than-normal water temperatures in parts of the Pacific Ocean in the past three months, O'Lenic said at a meeting of the American Meteorological Society in Atlanta.
O'Lenic said though it is too early to predict the ultimate effects of this year's La Nina -- the agency has only about 50 years of data on La Nina occurrences -- he expects more strong hurricane activity in the Atlantic.
Hurricane-friendly conditions are expected "for quite a while, a decade or more," he said.
Internationally, La Nina typically creates more rainfall across Indonesia and northern Australia, the Amazon basin and southeastern Africa. Places across the eastern half of the equatorial Pacific and eastern equatorial Africa usually experience drier weather.
La Nina is the opposite of the better-known El Nino, a Pacific warming trend. The last La Nina was in 2000-01.
La Nina updates are expected from the climate center on February 9 and in mid-March. Atlantic and Pacific hurricane outlooks will be released in mid-May.
Story Courtesy of CNN
http://www.cnn.com/2006/WEATHER/02/02/la.nina.returns.ap/index.html
Reprint of NOAA webpage
What is La Niña? Previous Cold Phases Temperature and Precipitation Impacts
During La Niña Typical La Niña Impacts What does La Niña mean? |
||
Source for the Previous Information
http://www.publicaffairs.noaa.gov/lanina.html
La Nina Hurricane Stats Provided by NOAA
What are the Trends?
Red Zone: After 1986
Yellow Zone: Before 1986
| Previous Year Hurricane Totals | La Nina Year Hurricane Totals | La Nina Year | Deviation from La Nina Year |
| 16 | 19 | 2000 | +3 |
| 7 | 21 | 1995 | +14 |
| 7 | 12 | 1988 | +5 |
| 10 | 17.33 | Average | |
| 11 | 9 | 1975 | -2 |
| 7 | 8 | 1973 | +1 |
| 18 | 10 | 1970 | -8 |
| 9 | 12 | 1964 | +3 |
| 11 | 12 | 1955 | +1 |
| 13 | 13 | 1950 | 0 |
| 9 | 8 | 1938 | -1 |
| 7 | 6 | 1928 | -1 |
| 7 | 8 | 1924 | +1 |
| 4 | 11 | 1916 | +7 |
| 4 | 3 | 1910 | -1 |
| 0 | 5 | 1908 | +5 |
| 8 | 2 | 1904 | -6 |
| 8.30 | 8.23 | Average |
All Rights Reserved: © Copyright 2006