ATLANTIC BASIN SEASONAL HURRICANE FORECAST FOR 2005
Forecast Parameter and 1950-2000 1 April
Climatology (in parentheses) 2004 2005
By
William M. Gray1 and Philip J. Klotzbach2
--------------------------------------------------------------------------------
Brief
| Average Number | 2005 | |
| Named Storms (NS) | (9.6) | 13 |
| Named Storm Days (NSD) | (49.1) | 65 |
| Hurricanes (H) | (5.9) | 7 |
| Hurricane Days (HD) | (24.5) | 35 |
| Intense Hurricanes (IH) | (2.3) | 3 |
| Intense Hurricane Days (IHD) | (5.0) | 7 |
| Net Tropical Cyclone Activity (NTC) | (100%) | 135 |
PROBABILITIES FOR AT LEAST ONE MAJOR (CATEGORY 3-4-5) HURRICANE LANDFALL ON EACH
OF THE FOLLOWING COASTAL AREAS:
1) Entire U.S. coastline - 73% (average for last century is 52%)
2) U.S. East Coast Including the Florida Peninsula - 53% (average for last
century is 31%)
3) Gulf Coast from the Florida Panhandle westward to Brownsville - 41% (average
for last century is 30%)
4) Expected above-average major hurricane landfall risk in the Caribbean
*************************************
http://hurricane.atmos.colostate.edu/forecasts/2005/april2005/
Reprint of the Entire Report Below
We foresee an above-average hurricane season for the Atlantic basin in 2005.
Also, an above-average probability of U.S. major hurricane landfall is
anticipated. We have adjusted our forecast upward from our early December
forecast and may further raise our prediction in our later updates if we can be
sure El Niño conditions will not develop.
(as of 1 April 2005)
This forecast is based on new research by the authors,
along with current meteorological information through March 2005
By
William M. Gray1 and Philip J. Klotzbach2
with assistance from William Thorson3
[This forecast as well as past forecasts and verifications are available via the
World Wide
Web: http://hurricane.atmos.colostate.edu/Forecasts
- also,
Brad Bohlander, Colorado State University Media Representative, (970-491-6432)
is available to answer various questions about this forecast.
Department of Atmospheric Science
Colorado State University
Fort Collins, CO 80523
email: barb@tutt.atmos.colostate.edu
ATLANTIC BASIN SEASONAL HURRICANE FORECAST FOR 2005
Issue Date
Issue Date
Forecast Parameter and 1950-2000
3 December
1 April
Climatology (in parentheses)
2004
2005
Named Storms (NS) (9.6)
11
13
Named Storm Days (NSD) (49.1)
55
65
Hurricanes (H)(5.9)
6
7
Hurricane Days (HD)(24.5)
25
35
Intense Hurricanes (IH) (2.3)
3
3
Intense Hurricane Days (IHD)(5.0)
6
7
Net Tropical Cyclone Activity (NTC)(100%)
115
135
1) Entire U.S. coastline - 73% (average for last century is 52%)
2) U.S. East Coast Including the Florida Peninsula - 53% (average for last century is 31%)
3) Gulf Coast from the Florida Panhandle westward to Brownsville - 41% (average for last century is 30%)
4) Expected above-average major hurricane landfall risk in the Caribbean
Information obtained through March 2005 indicates that the 2005 Atlantic hurricane season will be an active one. We estimate that 2005 will have about 7 hurricanes (average is 5.9), 13 named storms (average is 9.6), 65 named storm days (average is 49), 35 hurricane days (average is 24.5), 3 intense (category 3-4-5) hurricanes (average is 2.3) and 7 intense hurricane days (average is 5.0). We expect Atlantic basin Net Tropical Cyclone (NTC) activity in 2005 to be about 135 percent of the long-term average. The probability of U.S. major hurricane landfall is estimated to be 140 percent of the long-period average. We expect this year to continue the past-decade trend of above-average hurricane seasons.
This early April forecast is based on a newly devised extended range statistical forecast procedure which utilizes 52 years of past global reanalysis data. Analog predictors are also utilized. We have increased our forecast from our early December prediction due to a continued Atlantic Ocean warming and a belief that significant El Niño conditions for this summer/fall are now less likely. If the next few months verify this supposition, it is probable that we will be further raising our 31 May and 5 August seasonal forecast numbers. Conditions in the Atlantic are very favorable for an active hurricane season.
Our initial early April seasonal hurricane forecast scheme demonstrated hindcast skill for the period of 1950-1995. Our new, recently developed early April forecast scheme uses more hindcast years (1950-2001) and shows improved hindcast skill and better physical insights into why such precursor relationships have an extended period memory.
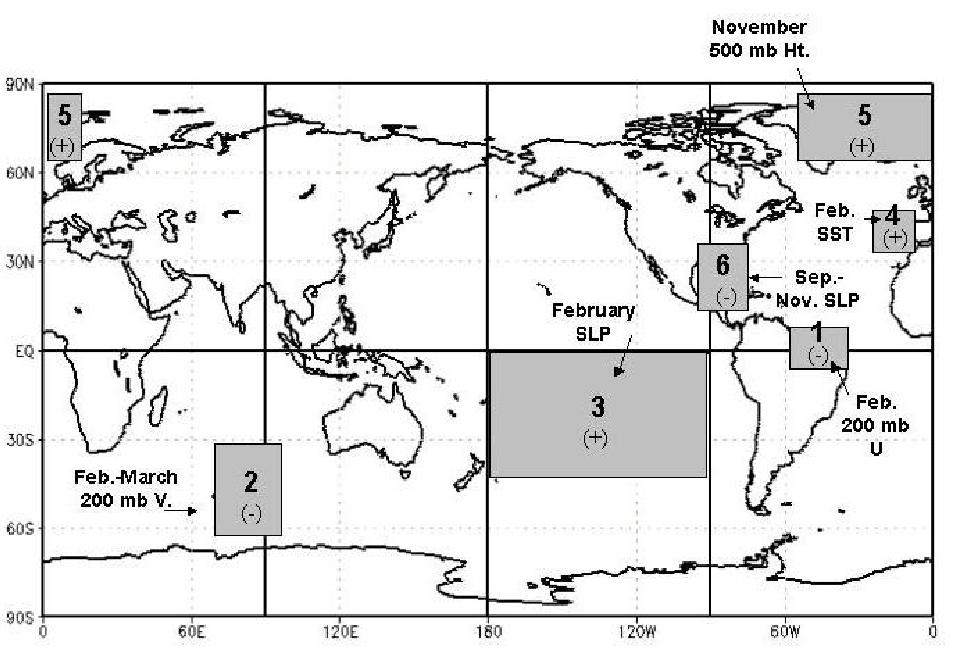
Through extensive analyses of NOAA-NCEP reanalysis products, second author Phil
Klotzbach has recently developed a new set of 1 April extended range predictors
which shows superior hindcast prediction skill over our previous 1 April
forecast scheme. The location of each of these new predictors is shown in Fig. 1.
The pool of six predictors for this new extended range forecast is given in
Table 1. Strong statistical relationships can be extracted via combinations of
these predictors (which are available by the end of March) and the amount of
Atlantic basin hurricane activity occurring later in the year.
|
| Values for 2005 Forecast | |
|---|---|
| (1) - February 200 MB U (5°S-10°N, 35-55°W) (-) | +0.1 SD |
| (2) - February-March 200 MB V (35-62.5°S, 70-95°E) (-) | +0.6 SD |
| (3) - February SLP (0-45°S, 90-180°W) (+) | -2.0 SD |
| (4) - February SST (35-50°N, 10-30°W) (+) | +1.5 SD |
| (5) - Previous November 500 MB Ht. (67.5-85°N, 50°W-10°E) (+) | 0.0 SD |
| (6) - Previous September-November SLP (15-35°N, 75-95°W) (-) | -0.7 SD |
Brief descriptions of our early April predictors follow:
Predictor 1. February 200 MB U in Equatorial East Brazil (-)
Easterly upper-level zonal wind anomalies off the northeast coast of South America imply that the upward branch of the Walker Circulation associated with ENSO remains in the western Pacific and that cool ENSO or La Niña conditions are likely to be present in the eastern equatorial Pacific for the next 4-6 months. El Niño conditions shift the upward portion of the Walker Circulation to the eastern Pacific and cause 200 mb westerly wind anomalies over the tropical Atlantic. These anomalies inhibit Atlantic hurricane activity.
Predictor 2. February-March 200 MB V in the Southern Indian Ocean (-)
Anomalous winds from the north at 200 mb in the southern Indian Ocean is associated with a northeastward shift of the South Indian Convergence Zone (SICZ) (Cook 2000), a more longitudinally concentrated upward branch of the Hadley Cell near Indonesia and warm sea surface temperatures throughout most of the Indian Ocean. This also implies that warm ENSO conditions have likely been prevalent throughout the past several months due to the lag teleconnected effect of a warm Indian Ocean with a warm eastern Pacific Ocean. Strong lag correlations (r > 0.4) with this predictor indicate that a change in phase of ENSO from warm to cool is likely during the summer.
Predictor 3. February SLP in the Southeast Pacific (+)
High sea level pressure in the eastern Pacific south of the equator indicates a positive Southern Oscillation Index (SOI) and stronger-than-normal trade winds across the Pacific. Increased trades drive enhanced upwelling off the west coast of South America that are typical of La Niña and hurricane-enhancing conditions. Cool sea surface temperatures are associated with these higher surface pressures that tend to persist throughout the spring and summer thereby reducing vertical wind shear over the tropical Atlantic and providing more favorable conditions for tropical cyclone development.
Predictor 4. February SST off the Northwestern European Coast (+)
Warm sea surface temperatures off the northwest coast of Europe correlate quite strongly with warm sea surface temperatures across the entire North Atlantic Ocean. A warm North Atlantic Ocean indicates that the thermohaline circulation is likely stronger than normal, the subtropical high near the Azores is weaker than normal and consequently trade wind strength across the Atlantic is also reduced. Weaker trade winds induce less upwelling which keeps the tropical Atlantic warmer than normal. This pattern tends to persist throughout the spring and summer implying a warmer tropical Atlantic during the hurricane season which is an enhancing factor for developing tropical waves.
Predictor 5. Previous November 500 MB Geopotential Height in the far North
Atlantic (+)
Positive values of this predictor correlate very strongly (r = -0.7) with negative values of the Arctic Oscillation (AO) and the North Atlantic Oscillation (NAO). Negative AO and NAO values imply more ridging in the central Atlantic and a likely warm north Atlantic Ocean (50-60°N, 10-50°W). Also, on decadal timescales, weaker zonal winds in the subpolar areas are indicative of a relatively strong thermohaline circulation which is favorable for hurricane activity. Positive values of this November index are negatively correlated with both 200 mb zonal winds and trade winds the following September in the tropical Atlantic. The associated reduced tropospheric vertical wind shear enhances conditions for TC development. Other features that are directly correlated with this predictor are low sea level pressure in the Caribbean and a warm North and Tropical Atlantic the following summer. Both of the latter are also hurricane-enhancing factors.
Predictor 6. Previous September-November SLP in the Gulf - SE USA (-)
Low pressure in this area during September-November of the previous year correlates quite strongly with the positive phase of the PNA. According to Horel and Wallace (1981), the PNA is positive during the final year of most warm ENSO events. Therefore, a change to neutral or cool ENSO conditions are to be expected the following year. This feature is also strongly correlated with the following year's August-September sea level pressure in the tropical and subtropical Atlantic. August-September SLP in the tropical Atlantic is one of the most important predictors for seasonal activity, that is, lower-than-normal sea level pressures in the tropical Atlantic provide more favorable conditions for TC activity. In addition, easterly anomalies at 200 mb throughout the tropical Atlantic are typical during the following year's August-September period with low SLP values.
Table 2 shows the degree of hindcast variance explained by our 1 April forecast scheme based upon our 52 year developmental dataset (1950-2001). To reduce overfitting, we use no more than five predictors. Note that there is substantial skill for predictions of HD and NTC.
The 1 April forecast picks the best combination of five predictors from a pool
of six predictors or until the hindcast variance explained increases less than
three percent through the addition of another predictor.
| Jackknife Skill | ||
|---|---|---|
| Variance (r2) | (Year of Forecast Not in the | |
| Variables Selected | Explained | Developmental Data Set) |
|
|
||
| NS- 1 2 4 5 | 0.454 | 0.338 |
| NSD- 1 2 4 5 | 0.594 | 0.496 |
| H- 2 3 5 6 | 0.529 | 0.414 |
| HD- 1 2 5 6 | 0.650 | 0.566 |
| IH- 2 3 4 5 | 0.610 | 0.527 |
| IHD- 1 2 4 5 6 | 0.548 | 0.460 |
| NTC- 1 2 4 5 6 | 0.707 | 0.637 |
Certain years in the historical record have global oceanic and atmospheric trends which are substantially similar to 2005. These years also provide useful clues as to likely trends in activity that the forthcoming 2005 hurricane season may bring. For this 1 April forecast, we project atmospheric and oceanic conditions for August through October 2005 and determine which of the prior years in our database have distinct trends in key environmental conditions which are similar to current March 2005 conditions. Table 3 lists our analog selections.
Analog Years. We have found four prior hurricane seasons since 1949 which
appear to be similar to current March 2005 conditions and projected 2005
August-October conditions. Specifically, we expect the North Atlantic (50-60°N,
10-50°W) warm SST anomalies to remain
warm for the 2005 hurricane season due to the predominately negative values of
the AO and NAO since the middle part of January. An usually warm north Atlantic
is indicative of a strong Atlantic thermohaline circulation. The tropical
equatorial Quasi-Biennial Oscillation (QBO) is projected to be from an easterly
direction. Easterly QBO conditions typically act to slightly reduce Atlantic
major hurricane activity. We anticipate that the recent global atmosphere and
ocean circulation regimes which have been present in all but two of the last ten
years will continue to be present in 2005. In addition, we looked for years that
had weak El Niño conditions the previous fall and winter with neutral ENSO
conditions in the eastern and central Pacific observed during the summer of the
year being selected.
There have been four hurricane seasons since 1949 with characteristics similar
to what we observe in March 2005 and what we anticipate for the summer/fall 2005
period. These best analog years are 1952, 1959, 1995 and 2003 (Table 3). Thus,
based on this analysis, we expect 2005 to be an active hurricane season and in
line with the average of eight of the last ten years (1995, 1996; 1998-2001;
2003, 2004). We anticipate 2005 to be considerably more active than the average
season during the inactive 1970-1994 period.
| NS | NSD | H | HD | IH | IHD | NTC | ||
|---|---|---|---|---|---|---|---|---|
|
|
||||||||
| 1952 | 7 | 40 | 6 | 23 | 3 | 4.00 | 93 | |
| 1959 | 11 | 40 | 7 | 22 | 2 | 3.75 | 94 | |
| 1995 | 19 | 121 | 11 | 62 | 5 | 11.5 | 222 | |
| 2003 | 16 | 80 | 7 | 33 | 3 | 16.75 | 173 | |
|
|
||||||||
| Mean | 13.3 | 70.3 | 7.8 | 35.0 | 3.3 | 9.0 | 146 | |
|
|
||||||||
| 2005 Forecast | 13 | 65 | 7 | 35 | 3 | 7 | 135 | |
Table 4 provides a comparison of our statistical and analog forecast techniques along with the final adjusted forecast and climatology. Column 1 is our 1 April statistical scheme, column 2 is our analog scheme, column 3 is our adjusted final forecast, and column 4 is the 1950-2000 climatology. Our final forecast is an average of our statistical and analog forecast techniques, with slightly higher weighting toward our analog technique.
| (1) | (2) | (3) | (4) | |
|---|---|---|---|---|
| Forecast | Statistical | Analog | 1 April 2005 | 1950-2000 |
| Parameter | Forecast | Forecast. | Final Fcst | Climatology |
|
|
||||
| Named Storms (NS) | 10.0 | 13.3 | 13 | 9.6 |
| Named Storm Days (NSD) | 52.7 | 70.3 | 65 | 49.1 |
| Hurricanes (H) | 4.5 | 7.8 | 7 | 5.9 |
| Hurricane Days (HD) | 23.1 | 35.0 | 35 | 24.5 |
| Intense Hurricanes (IH) | 1.5 | 3.3 | 3 | 2.3 |
| Intense Hurricane Days (IHD) | 6.6 | 9.0 | 7 | 5.0 |
| Net Tropical Cyclone Activity (NTC) | 110 | 146 | 135 | 100 |
We have been closely watching the eastward propagation of a series of equatorial Madden-Julian (MJO) waves in the western and central Pacific for their possible influence on the development of a significant El Niño event for this upcoming year. A moderate El Niño event would likely reduce the number of Atlantic hurricanes occurring during the 2005 season. We currently do not expect a significant El Niño event to develop. If the next few months verify this supposition, then it is probable that we will be raising our 31 May and 5 August seasonal forecast numbers to be more in line with the average of 8 of the last 10 hurricane seasons.
This will be an easterly Quasi-Biennial Oscillation (QBO) year. Low-latitude Atlantic hurricane activity is typically reduced in these seasons. But, this association has not worked well since we have entered this new era of enhanced activity that began in 1995. We do not anticipate the QBO exerting a significant reducing influence on this year's activity.
A significant focus of our recent research involves efforts to develop forecasts of the probability of hurricane landfall along the U.S. coastline. Whereas individual hurricane landfall events cannot be accurately forecast months in advance, the total seasonal probability of landfall can be forecast with statistical skill. With the observation that, statistically, landfall is a function of varying climate conditions, a probability specification has been developed through statistical analyses of all U.S. hurricane and named storm landfall events during the last 100 years (1900-1999). Specific landfall probabilities can be given for all cyclone intensity classes for a set of distinct U.S. coastal regions.
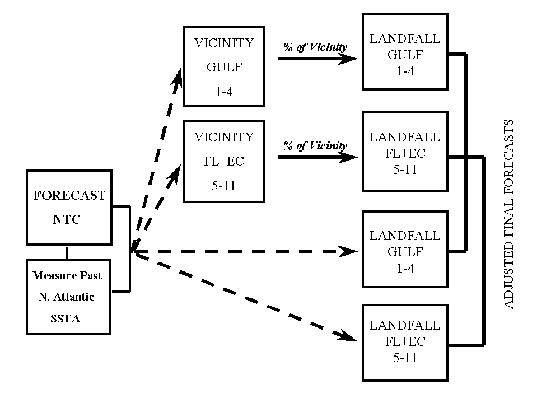 |
Figure 2 provides a flow diagram showing how these forecasts are made. Net
landfall probability is shown linked to the overall Atlantic basin Net Tropical
Cyclone activity (NTC; see Table 5) and to climate trends linked to
multi-decadal variations of the Atlantic Ocean thermohaline circulation as
inferred from recent past years of North Atlantic SSTA*.
Higher values of SSTA* generally indicate greater Atlantic hurricane activity,
especially for intense or major hurricanes. Atlantic basin NTC can be skillfully
hindcast, and the strength of the Atlantic Ocean thermohaline circulation can be
inferred as SSTA* from North Atlantic SST anomalies in the current and prior
years. These relationships are then utilized to make probability estimates for
U.S. landfall. The current (March 2005) value of SSTA* is 62. Hence, in
combination with a prediction of NTC of 135 for 2005, a combination of NTC +
SSTA* of (135 + 62) yields a value of 197.
As shown in Table 5, NTC is a combined measure of the year-to-year mean of six
indices of hurricane activity, each expressed as a percentage difference from
the long-term average. Although many active Atlantic hurricane seasons feature
no landfalling hurricanes, and some inactive years experience one or more
landfalling hurricanes, it is found that, on average, the more active the
overall Atlantic basin hurricane season is, the greater the probability of U.S. hurricane
landfall. For example, landfall observations during the last 100 years show that
a greater number of intense (Saffir-Simpson category 3-4-5) hurricanes strike
the Florida and U.S. East Coast during years of (1) increased NTC and (2)
above-average North Atlantic SSTA* conditions.
| 1950-2000 Average | ||
|---|---|---|
|
|
||
| 1) | Named Storms (NS) | 9.6 |
| 2) | Named Storm Days (NSD) | 49.1 |
| 3) | Hurricanes (H) | 5.9 |
| 4) | Hurricane Days (HD) | 24.5 |
| 5) | Intense Hurricanes (IH) | 2.3 |
| 6) | Intense Hurricane Days (IHD) | 5.0 |
Table 6 lists strike probabilities for different TC categories for the entire
U.S. coastline, the Gulf Coast and Florida, and the East Coast for 2005.
The mean annual probability of one or more landfalling systems is given in
parentheses. Note that Atlantic basin NTC activity in 2005 is expected to be
greater than the long-term average (135), and North Atlantic SSTA* values are
measured to be above average (62 units). U.S. hurricane landfall
probability is thus expected to be above average owing to both a higher NTC and
above-average North Atlantic SSTAs. During periods of positive North Atlantic
SSTA*, a higher percentage of Atlantic basin major hurricanes cross the Florida
and eastern U.S. coastline for a given level of NTC.
| Coastal | Category 1-2 | Category 3-4-5 | All | Named | |
|---|---|---|---|---|---|
| Region | TS | HUR | HUR | HUR | Storms |
|
|
|||||
| Entire U.S. (Regions 1-11) | 87% (80) | 82% (68) | 73% (52) | 95% (84) | 99% (97) |
| Gulf Coast (Regions 1-4) | 69% (59) | 54% (42) | 41% (30) | 73% (61) | 92% (83) |
| Florida plus East Coast (5-11) | 59% (51) | 60% (45) | 53% (31) | 82% (62) | 92% (81) |
Over the past four years, we have been compiling and synthesizing our landfalling hurricane data and have developed a webpage application with extensive landfall probabilities for the Gulf and East Coasts of the United States. In partnership with the GeoGraphics Laboratory at Bridgewater State College, a web application has been created that displays landfall probabilities for eleven regions, 55 subregions and all 205 U.S. coastal and near-coastal counties from Brownsville, Texas to Eastport, Maine. Individual probabilities of sustained winds of tropical storm force (40-75 mph), hurricane force ( > 75 mph) and intense or major hurricane force ( > 115 mph) are also given. These probabilities are based on the current forecast of NTC activity and on current values of SSTA*. Probabilities of winds in the vicinity of a subregion and county as well as 50-year probabilities for winds of tropical storm force, hurricane force, and intense hurricane force are also provided. Table 7 summarizes the data currently available on the webpage.
| Annual | Annual | ||
|---|---|---|---|
| Landfall | Vicinity | 50-Year | |
| Probability | Probability | Probability | |
|
|
|||
| NS | X | X | X |
| H | X | X | X |
| IH | X | X | X |
 |
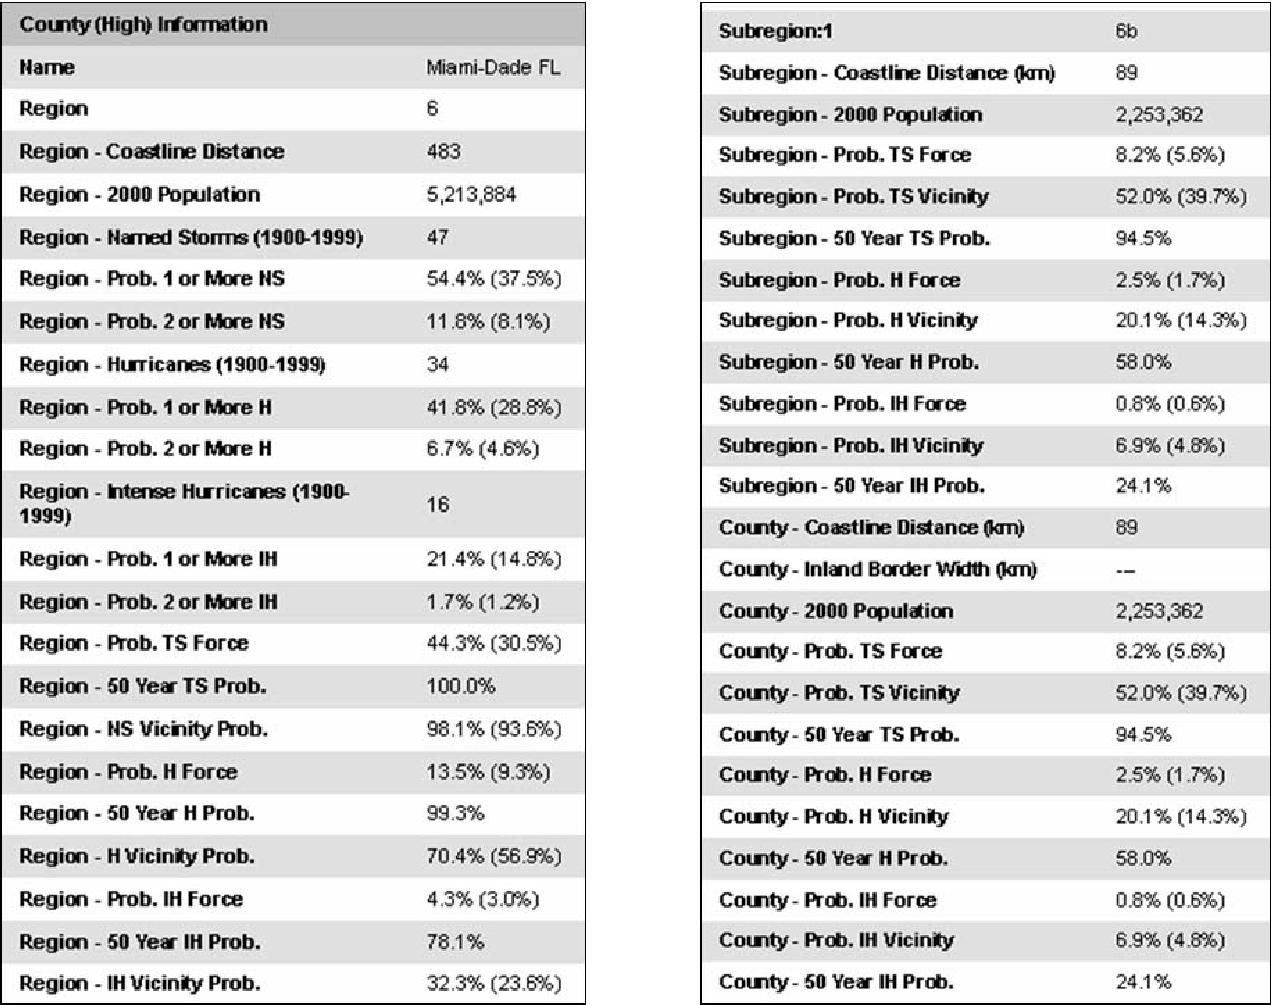 |
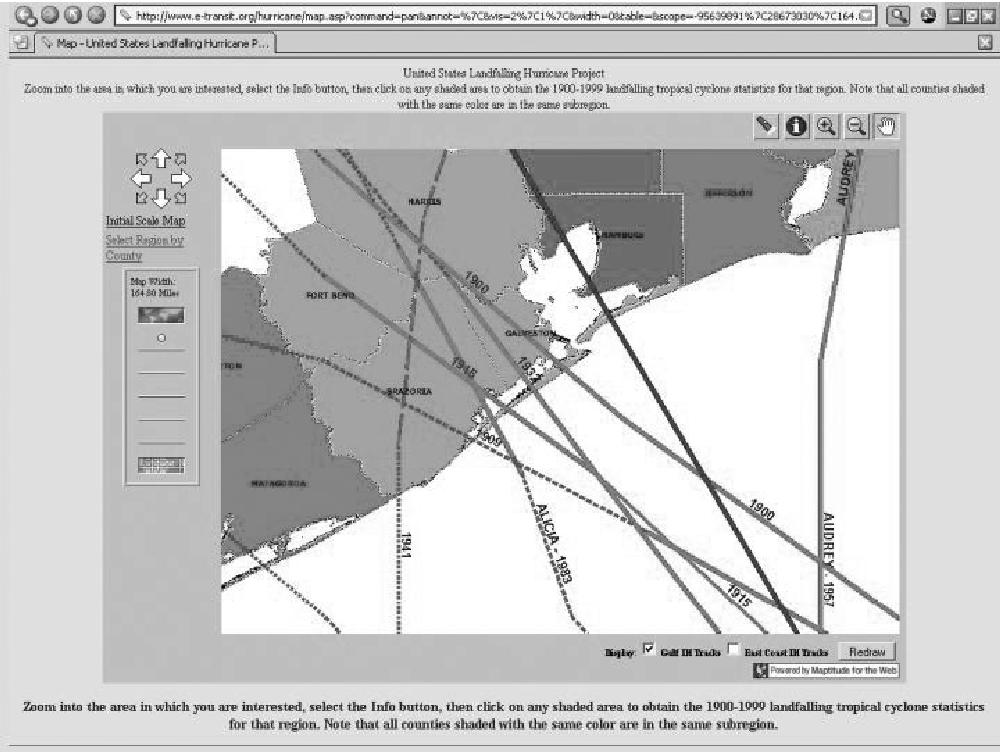
Figures 3 and 4 display example screens of data that is available on this
website. The user can select tracks of all intense hurricanes that have made
landfall in a given area over the last 100 years. This webpage is currently
available at http://www.e-transit.org/hurricane.
One can also reach this webpage from a link off the CSU Tropical Meteorology
Project homepage http://hurricane.atmos.colostate.edu.
Many individuals have queried whether the unprecedented landfall of four destructive hurricanes in a seven-week period during August-September 2004 is related in any way to human-induced climate changes. There is no evidence that this is the case. If global warming were the cause of the increase in United States hurricane landfalls in 2004 and the overall increase in Atlantic basin major hurricane activity of the past ten years (1995-2004), one would expect to see an increase in tropical cyclone activity in the other storm basins as well (ie., West Pacific, East Pacific, Indian Ocean, etc.). This has not occurred. When tropical cyclones worldwide are summed, there has actually been a slight decrease since 1995. In addition, it has been well-documented that the measured global warming of about 0.5°C during the 25-year period of 1970-1994 was accompanied by a downturn in Atlantic basin hurricane activity over this quarter-century period.
We attribute the heightened Atlantic major hurricane activity of 2004 season as
well as the increased Atlantic major hurricane activity of the previous nine
years to be a consequence of the multidecadal fluctuations in the Atlantic Ocean
thermohaline circulation (THC) as we have been discussing in our Atlantic basin
seasonal hurricane forecasts for several years. Major hurricane activity in the
Atlantic has been shown to undergo marked multidecadal fluctuations that are
directly related to North Atlantic sea surface temperature anomalies. When the
Atlantic Ocean thermohaline circulation is running strong, the central Atlantic
equatorial trough (ITCZ) becomes stronger. The stronger the Atlantic equatorial
trough becomes, the more favorable are conditions for the development of major
hurricanes in the central Atlantic. Since 1995, the THC has been flowing more
strongly, and there has been a concomitant increase in Atlantic major hurricanes
in the tropical Atlantic. Even though the 2004 hurricane season has been quite
active, it is only somewhat more active than seven of the past nine hurricane
seasons (1995-1996, 1998-2001, 2003). It was the environmental steering currents
that drove four of the six major hurricanes of 2004 on such long, low-latitude
westerly tracks that made this season so special. The very damaging Atlantic
2004 hurricane season this year was simply a low probability event resulting
from unusual natural variability in the ocean-atmosphere system. Similarly, the
ten typhoons that struck Japan last year were also a rare statistical event that
was in part a consequence of the anomalously warm tropical central Pacific sea
surface temperatures and a weaker-than-normal West Pacific subtropical
anticyclone. This caused a high percentage of West Pacific typhoons that formed
in the central Pacific to be steered toward the Japanese Islands. Such high U.S. and
Japan landfalls events of last year should in no way be associated with the
human-induced global warming hypothesis.
Our forecasts are based on the premise that those global oceanic and atmospheric conditions which precede comparatively active or inactive hurricane seasons in the past provide meaningful information about similar trends in future seasons. It is important that the reader appreciate that these seasonal forecasts are based on statistical schemes which, owing to their intrinsically probabilistic nature, will fail in some years. Moreover, these forecasts do not specifically predict where within the Atlantic basin these storms will strike. The probability of landfall for any one location along the coast is very low and reflects the fact that, in any one season, most US coastal areas will not feel the effects of a hurricane no matter how active the individual season is. However, it must also be emphasized that a low landfall probability does not insure that hurricanes will not come ashore. Regardless of how active the 2005 hurricane season is, a finite probability always exists that one or more hurricanes may strike along the US coastline or the Caribbean Basin and do much damage.
We will be issuing seasonal updates of our 2005 Atlantic basin hurricane activity forecast on Tuesday 31 May (to coincide with the official start of the 2005 hurricane season on 1 June), Friday 5 August, Friday 2 September and Monday 3 October 2005. The 5 August, 2 September and 3 October forecasts will include separate forecasts of August-only, September-only and October-only Atlantic basin tropical cyclone activity. Table 8 displays our upcoming forecasts in a tabular format. A verification and discussion of all 2005 forecasts will be issued in late November 2005. Our first seasonal hurricane forecast for the 2006 hurricane season will be issued in early December 2005. All these forecasts will be available at our web address given on the front cover: http://hurricane.atmos.colostate.edu/Forecasts.
| Date | 31 May | 5 Aug. | 3 Sep. | 2 Oct. |
|---|---|---|---|---|
|
|
||||
| Seasonal Forecast | X | X | X | X |
| Monthly Forecast | X | X | X | |
The first author gratefully acknowledges valuable input to his CSU project research over many years by former graduate students and now colleagues Chris Landsea, John Knaff and Eric Blake. We thank Professors Paul Mielke and Ken Berry for much statistical analysis and advice over many years. A number of meteorologists have furnished us with the data and given valuable assessments of the current state of global atmospheric and oceanic conditions. This includes Arthur Douglas, Richard Larsen, Todd Kimberlain, Ray Zehr and Mark DeMaria. In addition, Barbara Brumit and Amie Hedstrom have provided excellent manuscript, graphical, and data analysis assistance over a number of years. We have profited over the years from many indepth discussions with most of the current and past NHC hurricane forecasters. The first author would further like to acknowledge the encouragement he has received for this type of forecasting research application from Neil Frank, Robert Sheets, Robert Burpee, Jerry Jarrell, former directors of the National Hurricane Center (NHC), and from the current director, Max Mayfield and their forecast staffs. Uma Shama and Larry Harman of Bridgewater State College, MA have provided assistance and technical support in the development of our Landfalling Hurricane Probability Webpage. We also thank Bill Bailey of the Insurance Information Institute for his sage advice and encouragement.
The financial backing for the issuing and verification of these forecasts has in
part been supported by the National Science Foundation and by the Research
Foundation of AIG - Lexington Insurance Company (a member of the American
International Group) for the last two years. We thank the GeoGraphics Laboratory
at Bridgewater State College for their assistance in developing the Landfalling
Hurricane Probability Webpage.
Table 9: Summary verification of the authors' six previous years of seasonal
forecasts for Atlantic TC activity between 1999-2004. Verification of our
earlier year forecasts for the years 1984-1998 are given in our late November
seasonal verifications (on this Web location).
| Update | Update | Update | |||
|---|---|---|---|---|---|
| 1999 | 5 Dec 1998 | 7 April | 4 June | 6 August | Obs. |
|
|
|||||
| No. of Hurricanes | 9 | 9 | 9 | 9 | 8 |
| No. of Named Storms | 14 | 14 | 14 | 14 | 12 |
| No. of Hurricane Days | 40 | 40 | 40 | 40 | 43 |
| No. of Named Storm Days | 65 | 65 | 75 | 75 | 77 |
| Hurr. Destruction Potential(HDP) | 130 | 130 | 130 | 130 | 145 |
| Major Hurricanes (Cat. 3-4-5) | 4 | 4 | 4 | 4 | 5 |
| Major Hurr. Days | 10 | 10 | 10 | 10 | 15 |
| Net Trop. Cyclone (NTC) Activity | 160 | 160 | 160 | 160 | 193 |
| Update | Update | Update | |||
|---|---|---|---|---|---|
| 2000 | 8 Dec 1999 | 7 April | 7 June | 4 August | Obs. |
|
|
|||||
| No. of Hurricanes | 7 | 7 | 8 | 7 | 8 |
| No. of Named Storms | 11 | 11 | 12 | 11 | 14 |
| No. of Hurricane Days | 25 | 25 | 35 | 30 | 32 |
| No. of Named Storm Days | 55 | 55 | 65 | 55 | 66 |
| Hurr. Destruction Potential(HDP) | 85 | 85 | 100 | 90 | 85 |
| Major Hurricanes (Cat. 3-4-5) | 3 | 3 | 4 | 3 | 3 |
| Major Hurr. Days | 6 | 6 | 8 | 6 | 5.25 |
| Net Trop. Cyclone (NTC) Activity | 125 | 125 | 160 | 130 | 134 |
| Update | Update | Update | |||
|---|---|---|---|---|---|
| 2001 | 7 Dec 2000 | 6 April | 7 June | 7 August | Obs. |
|
|
|||||
| No. of Hurricanes | 5 | 6 | 7 | 7 | 9 |
| No. of Named Storms | 9 | 10 | 12 | 12 | 15 |
| No. of Hurricane Days | 20 | 25 | 30 | 30 | 27 |
| No. of Named Storm Days | 45 | 50 | 60 | 60 | 63 |
| Hurr. Destruction Potential(HDP) | 65 | 65 | 75 | 75 | 71 |
| Major Hurricanes (Cat. 3-4-5) | 2 | 2 | 3 | 3 | 4 |
| Major Hurr. Days | 4 | 4 | 5 | 5 | 5 |
| Net Trop. Cyclone (NTC) Activity | 90 | 100 | 120 | 120 | 142 |
| Update | Update | Update | Update | |||
|---|---|---|---|---|---|---|
| 2002 | 7 Dec 2001 | 5 April | 31 May | 7 August | 2 Sept | Obs. |
|
|
||||||
| No. of Hurricanes | 8 | 7 | 6 | 4 | 3 | 4 |
| No. of Named Storms | 13 | 12 | 11 | 9 | 8 | 12 |
| No. of Hurricane Days | 35 | 30 | 25 | 12 | 10 | 11 |
| No. of Named Storm Days | 70 | 65 | 55 | 35 | 25 | 54 |
| Hurr. Destruction Potential(HDP) | 90 | 85 | 75 | 35 | 25 | 31 |
| Major Hurricanes (Cat. 3-4-5) | 4 | 3 | 2 | 1 | 1 | 2 |
| Major Hurr. Days | 7 | 6 | 5 | 2 | 2 | 2.5 |
| Net Trop. Cyclone (NTC) Activity | 140 | 125 | 100 | 60 | 45 | 80 |
| Update | Update | Update | Update | Update | |||
|---|---|---|---|---|---|---|---|
| 2003 | 6 Dec 2002 | 4 April | 30 May | 6 August | 3 Sept | 2 Oct | Obs. |
|
|
|||||||
| No. of Hurricanes | 8 | 8 | 8 | 8 | 7 | 8 | 7 |
| No. of Named Storms | 12 | 12 | 14 | 14 | 14 | 14 | 16 |
| No. of Hurricane Days | 35 | 35 | 35 | 25 | 25 | 35 | 33 |
| No. of Named Storm Days | 65 | 65 | 70 | 60 | 55 | 70 | 75 |
| Hurr. Destruction Potential(HDP) | 100 | 100 | 100 | 80 | 80 | 125 | 131 |
| Major Hurricanes (Cat. 3-4-5) | 3 | 3 | 3 | 3 | 3 | 2 | 3 |
| Major Hurr. Days | 8 | 8 | 8 | 5 | 9 | 15 | 16.75 |
| Net Trop. Cyclone (NTC) Activity | 140 | 140 | 145 | 120 | 130 | 155 | 173 |
| Update | Update | Update | Update | Update | |||
|---|---|---|---|---|---|---|---|
| 2004 | 5 Dec 2003 | 2 April | 28 May | 6 August | 3 Sept | 1 Oct | Obs. |
|
|
|||||||
| No. of Hurricanes | 7 | 8 | 8 | 7 | 8 | 9 | 9 |
| No. of Named Storms | 13 | 14 | 14 | 13 | 16 | 15 | 14 |
| No. of Hurricane Days | 30 | 35 | 35 | 30 | 40 | 52 | 46 |
| No. of Named Storm Days | 55 | 60 | 60 | 55 | 70 | 96 | 90 |
| Major Hurricanes (Cat. 3-4-5) | 3 | 3 | 3 | 3 | 5 | 6 | 6 |
| Major Hurr. Days | 6 | 8 | 8 | 6 | 15 | 23 | 22 |
| Net Trop. Cyclone (NTC) Activity | 125 | 145 | 145 | 125 | 185 | 240 | 229 |
After considerable discussion, we have decided to remove
Subtropical Storm Nicole from our seasonal statistics for the 2004 Atlantic
basin hurricane season. Nicole was never considered tropical by the National
Hurricane Center, and therefore, it never achieved named storm status according
to our definition. The 2004 tropical cyclone statistics at the end of this
forecast have been changed accordingly.
1Professor of Atmospheric Science
2Research Associate
3Research
Associate
Forecast courtesy of Colorado State University
link: http://hurricane.atmos.colostate.edu/forecasts/2005/april2005/